CPU Bottlenecks: Symptoms, Tests and Fixes
Learn why a processor can hold back a graphics card, how to prove it with frame-time data, and what to change first.
Read CPU Bottlenecks: Symptoms, Tests and Fixes →A PC bottleneck is the stage that limits a defined workload, not a permanent label attached to one component. Use this map to separate normal utilization from lost performance, choose the right evidence and move into a focused guide without guessing from one percentage.
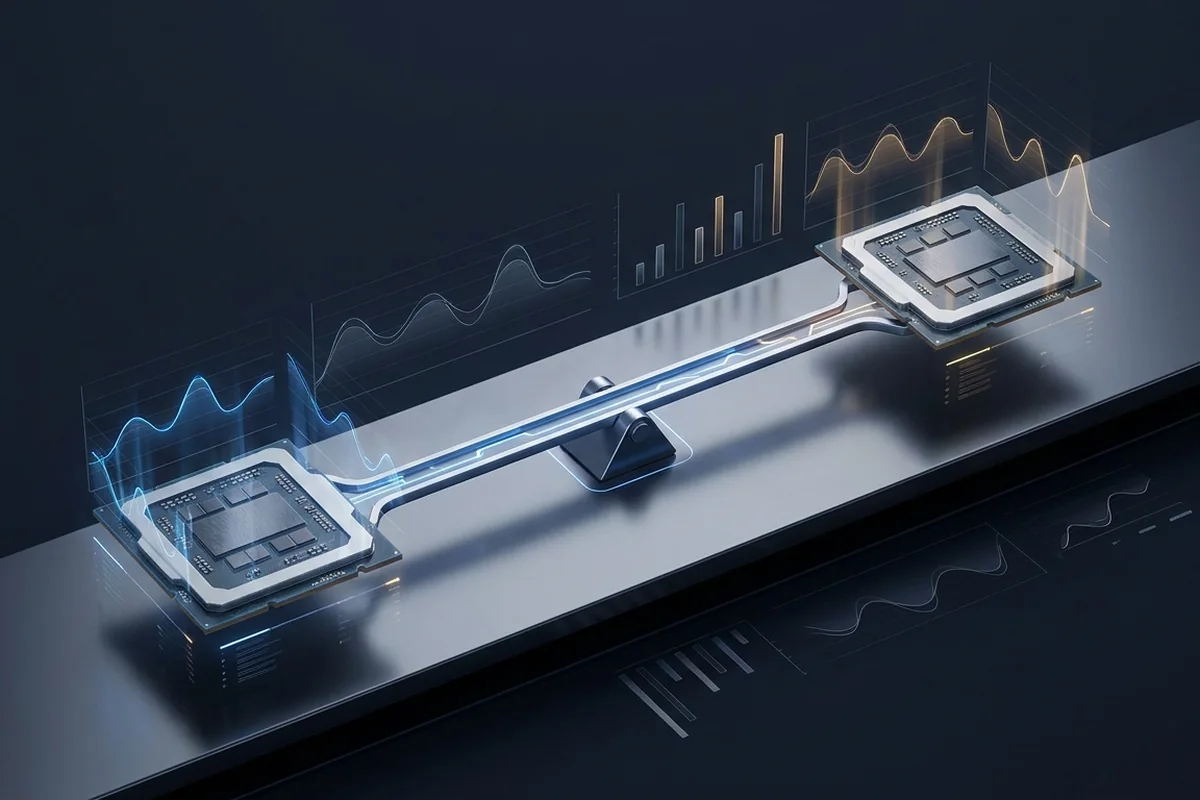
The processor prepares game logic, draw calls and operating-system work. The graphics card renders and processes visual or compute workloads. Memory, storage and PCIe links move the data both need, while cooling and power determine whether advertised clocks can be sustained. Any one of those stages can set the pace.
Start with the symptom that matters: missed frame target, stutter, slow export, delayed model loading or falling clocks. Then record the resources active during that exact event. Total CPU utilization alone is not enough because one critical thread can be saturated while the average remains modest.
High utilization is often a sign that hardware is being used well. A GPU near full utilization at the intended image quality is not automatically a fault. It becomes a practical bottleneck when its frame time misses the target and a controlled reduction in graphics work improves the result.
Configuration faults must be removed first. A disabled memory profile, reduced PCIe width, background task, temperature limit or frame cap can imitate a hardware mismatch. Replacing a component before restoring normal operation can move the same problem into a more expensive system.
A useful diagnosis changes one variable at a time. Lower internal resolution to test graphics sensitivity, cap frame rate to test CPU scheduling pressure, close background applications to test contention, and compare cold versus sustained runs to expose temperature behavior.
The result should be repeatable. If a change produces a different outcome on every run, stabilize the scene, warm-up state and monitoring setup before buying hardware. The linked guides below explain the evidence that is specific to each bottleneck type.
| Scenario | Signal or scale | Best next check |
|---|---|---|
| CPU or engine | Low GPU use with a saturated critical thread | Lower resolution and compare frame time |
| GPU or VRAM | High GPU use or memory-pressure stalls | Reduce graphics load or VRAM demand |
| RAM or storage | Paging, asset stalls or capacity pressure | Log allocation and I/O during the event |
| PCIe | Restricted link width or heavy transfer traffic | Verify negotiated link and transfer workload |
| Thermal or power | Clocks fall during a sustained run | Compare cold and warm traces with limit flags |
Start with the CPU and GPU bottleneck calculator, convert refresh targets with the FPS to frame-time calculator, or work through the diagnostic checklist.
Learn why a processor can hold back a graphics card, how to prove it with frame-time data, and what to change first.
Read CPU Bottlenecks: Symptoms, Tests and Fixes →Understand when high GPU usage is healthy, when graphics hardware is the true limit, and how to tune for better frame pacing.
Read GPU Bottlenecks: What 99% Usage Really Means →A practical guide to memory limits that can depress 1% lows even when the CPU and GPU look well matched.
Read RAM Bottlenecks: Capacity, Channels and Latency →Separate loading-time problems from frame-rate limits and diagnose asset-streaming stalls without guesswork.
Read Can an SSD Be a Gaming Bottleneck? →Know when interface bandwidth matters, how lane width changes the equation, and which configurations deserve attention.
Read PCIe Bottlenecks: Lanes, Generations and Real Impact →Two problems can look identical in an FPS graph. Here is how to tell falling clocks from an underpowered component.
Read Thermal Throttling vs. a Hardware Bottleneck →Learn how to identify single-core bottlenecks in modern games, test the likely cause and choose the next step from repeatable PC performance evidence.
Read Single-Core Bottlenecks in Modern Games →Learn how to identify how cpu cache affects gaming performance, test the likely cause and choose the next step from repeatable PC performance evidence.
Read How CPU Cache Affects Gaming Performance →Learn how to identify cpu bottlenecks in open-world games, test the likely cause and choose the next step from repeatable PC performance evidence.
Read CPU Bottlenecks in Open-World Games →