Start here
PC Bottleneck Guide: Diagnose CPU, GPU, RAM and Storage Limits
Understand every major limiting stage, follow one repeatable diagnostic workflow and make an upgrade decision based on evidence rather than a generic score.
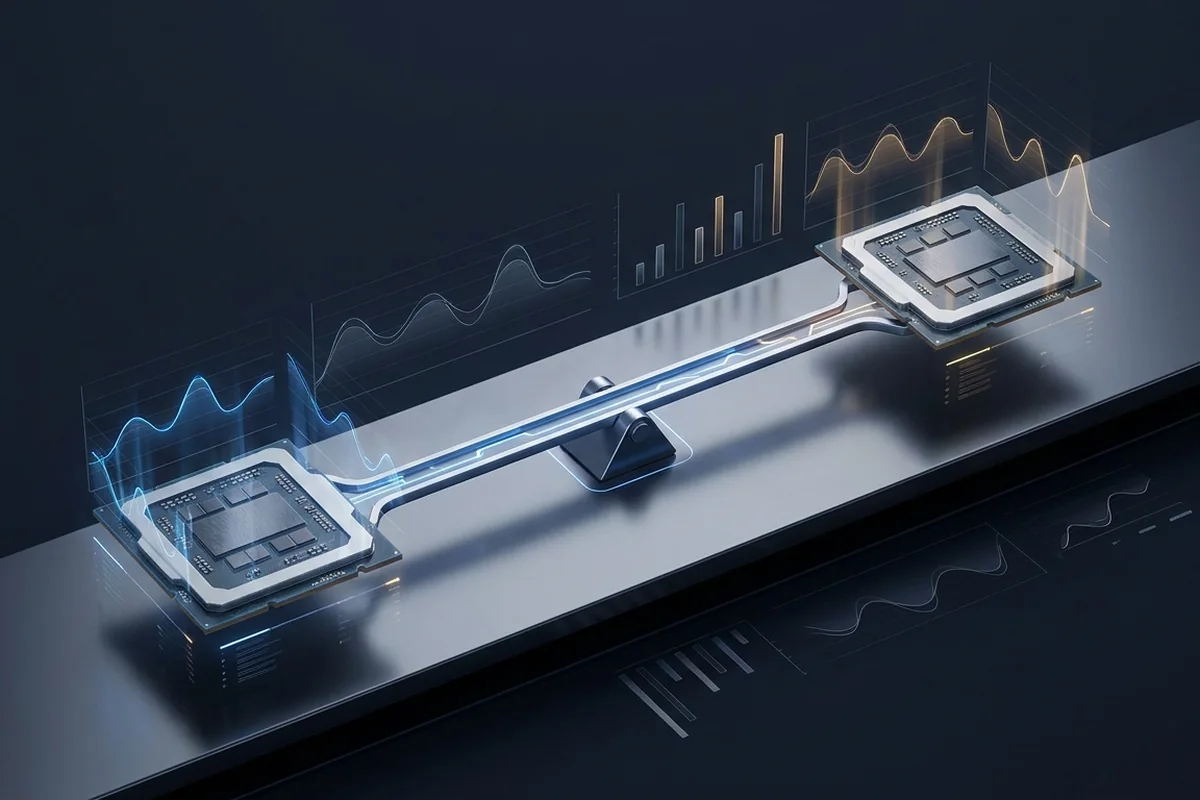
The mental model
A bottleneck is the slowest stage in a specific workload.
Your PC is a pipeline. The CPU prepares work, memory supplies data, the GPU renders, storage streams assets, and cooling allows every part to sustain its intended speed. The slowest stage controls the output. Change the workload and that stage can change.
There is no bottleneck-free PC.
The useful goal is to avoid a limit that materially blocks your frame-rate, smoothness or completion-time target.
| Signal | Likely direction | Confirm with |
|---|---|---|
| GPU 95–100%, stable clocks | Graphics workload | Lower resolution or upscaling |
| GPU usage low, one CPU thread high | CPU / engine | Low-resolution A/B test |
| Frame spikes with memory pressure | RAM / VRAM / storage | Capacity and I/O log |
| Performance falls as heat rises | Thermal or power limit | Clock and limit flags |
How each PC subsystem can become the limit
CPU and game-engine limits
The processor prepares draw calls, simulation, physics, animation and operating-system work. A game can be CPU-limited when one important thread is saturated even if total CPU usage looks modest. High refresh-rate targets make this path more demanding because each frame must be prepared in fewer milliseconds.
GPU, VRAM and graphics-setting limits
The graphics processor shades pixels, runs geometry and compute work, applies post-processing and may handle ray tracing or AI-assisted upscaling. Sustained high GPU usage is usually healthy. It becomes a practical bottleneck only when the resulting frame time misses your target or memory pressure creates stalls.
RAM, storage and data movement
Insufficient system memory can force paging, while a single-channel layout or unstable profile can depress CPU-side performance. Storage normally changes loading and streaming behavior more than steady FPS. PCIe bandwidth matters when effective lane width is restricted, data movement is unusually heavy or VRAM overflow sends traffic across the link.
Cooling and power delivery
A thermal or power limit is not the same as a normally utilized component. If effective clocks decline as temperature rises, restore the intended operating state before judging the hardware tier. A faster replacement installed into the same airflow or power problem may reproduce the symptom.
Knowledge map
Follow a topic from concept to fix.
Diagnostics
How to Check a PC Bottleneck in 20 Minutes →How to Read CPU and GPU Usage Correctly →Frame Time and 1% Lows: The Smoothness Metrics →What Does a Bottleneck Percentage Mean? →How to Read a Frame-Time Graph →Average FPS vs 1% Lows: What Each Metric Means →CPU Time vs GPU Time: Find the Slower Frame Stage →PC Benchmark Run-to-Run Variance Explained →Frame Caps and V-Sync in Bottleneck Testing →Resolution guides
PC Bottlenecks at 1080p →PC Bottlenecks at 1440p →PC Bottlenecks at 4K →Upgrade planning
How to Fix a CPU Bottleneck Before You Upgrade →How to Fix a GPU Bottleneck Without Ruining Image Quality →How to Choose a CPU for Any GPU →How to Plan a Balanced Gaming PC Build →Workloads
Gaming and Streaming Bottlenecks →Workstation Bottlenecks: Editing, Rendering and Compiling →AI Workstation Bottlenecks: VRAM, Bandwidth and Data Flow →AI Image Generation PC Guide: Build for Local Models →Build guides
FireForge Gaming PC Build Guide → Repeatable workflow
Diagnose before you spend.
Define the target
Name the game or application, resolution, settings and the frame-rate or completion-time goal.
Capture a baseline
Log frame time, utilization, effective clocks, power, temperatures and memory in the same scene.
Change one variable
Lower resolution or one subsystem-sensitive setting, repeat, then compare the response.
Fix lost performance
Resolve temperature, power, memory configuration and background-process problems first.
Price the complete upgrade
Include the platform, power supply, cooling and the value of the experience gained.
How to interpret bottleneck percentages
A percentage from an online calculator is not a predicted FPS loss. On this site it expresses the relative distance between scenario-adjusted CPU and GPU headroom indices. A small distance suggests a balanced pairing for the chosen inputs. A larger distance tells you which side deserves investigation first. The number changes when resolution, frame target or workload changes because the demand changes.
Do not replace a component merely because a result is outside the balanced band. First check whether the real software misses your target, whether the suspected component is operating normally and whether a controlled setting change produces the expected response. The methodology page publishes the exact formula and current scenario weights.
Continue from the estimate
Choose the next page by the question you need to answer. Keep the original scenario visible so the evidence stays connected to the result.
Explore, cite or publish the evidence
Use the wider library after the first diagnosis. The magazine develops individual performance questions, the resource collection identifies suitable primary references, and the widget lets publishers connect their own hardware guidance to the transparent calculator.
