Bottleneck Calculator Methodology: How the Score Works
Our model estimates the direction and relative severity of a CPU-GPU mismatch under a stated scenario. It does not promise a frame rate or replace measurement.
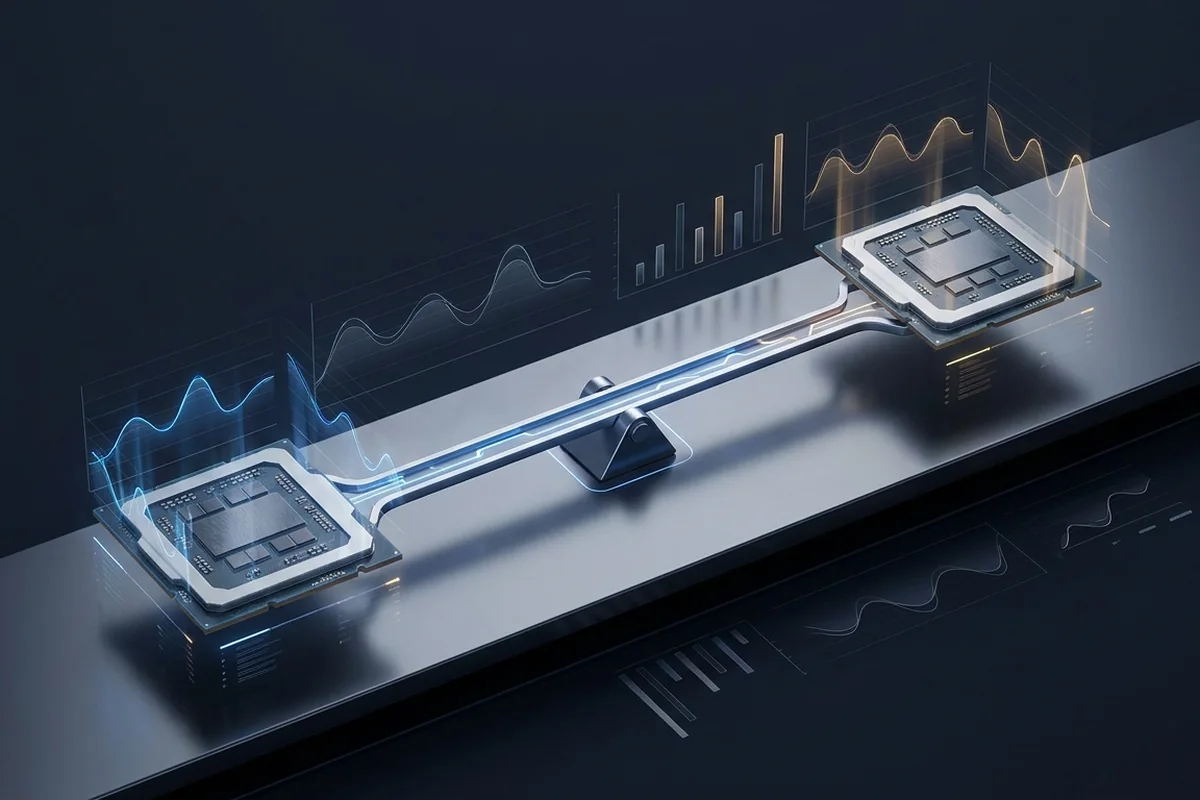
A normalized, scenario-weighted balance index
Each listed CPU and GPU has a normalized relative tier index. The calculator adjusts those indices for rendering resolution, target frame rate and workload, then compares the two adjusted headroom values. The lower value is reported as the likely limiting path. The model is designed for directional comparison, not for predicting the FPS of a specific game.
Game engine, settings, firmware, memory, cooling, drivers and background work can make two systems with the same named parts behave differently. Rounded severity bands are more honest than a decimal that implies laboratory precision.
The published calculation
Read the two headroom values
CPU headroom equals the CPU tier index multiplied by the resolution CPU factor, frame-target CPU factor and workload CPU factor. GPU headroom equals the GPU tier index multiplied by the resolution GPU factor and workload GPU factor.
The estimated imbalance is the absolute difference between those values divided by the larger value, multiplied by 100 and rounded to the nearest whole percentage. If the distance is below 8%, the model labels the pairing well balanced. Otherwise, the side with lower adjusted headroom is identified as the likely limit.
Resolution and frame-rate weights
| Input | CPU factor | GPU factor | Interpretation |
|---|---|---|---|
| 1920 × 1080 | 1.00 | 1.18 | Lower pixel load leaves relatively more GPU headroom. |
| 2560 × 1440 | 1.06 | 1.00 | Reference balance for the model. |
| 3840 × 2160 | 1.12 | 0.78 | Higher pixel load reduces relative GPU headroom. |
| Frame target | CPU factor | Model meaning |
|---|---|---|
| 60 FPS | 1.15 | Longer frame budget leaves more CPU headroom. |
| 120 FPS | 1.00 | Reference target. |
| 144 FPS | 0.92 | Shorter preparation budget increases CPU pressure. |
| 240+ FPS | 0.74 | Very short frame budget strongly emphasizes CPU throughput. |
Workload weights
| Workload | CPU factor | GPU factor | Reason |
|---|---|---|---|
| Gaming | 1.00 | 1.00 | Reference interactive workload. |
| Gaming and streaming | 0.86 | 0.97 | Capture, composition and encoding add overhead. |
| Content creation | 0.90 | 0.94 | Scheduling, effects and memory can load both paths. |
| Local AI | 1.02 | 0.82 | Accelerator throughput and memory fit dominate many runs. |
Worked calculation: Ryzen 9 9950X and RTX 5080 at 1440p
In the current catalogue, the Ryzen 9 9950X carries a CPU tier index of 91 and the GeForce RTX 5080 carries a GPU tier index of 84. At 2560 × 1440, 120 FPS and the gaming workload, the CPU side is 91 × 1.06 × 1.00 × 1.00 = 96.46. The GPU side is 84 × 1.00 × 1.00 = 84.
The absolute difference is 12.46. Dividing by the larger headroom value gives 12.9%, which rounds to 13%. Because the adjusted GPU value is lower, the interface reports a moderate GPU-side direction. This does not predict a 13% frame-rate loss. It says the graphics path is the first side to test under those inputs.
Select AMD Ryzen 9 9950X, NVIDIA GeForce RTX 5080, 2560 × 1440, 120 FPS and Gaming in the calculator. Component tiers or model weights may change after a documented review, so use the published revision date with any citation.
Severity bands and their limits
Below 8% is the balanced band. An 8-9% estimate is low, 10-19% moderate, 20-31% high and 32% or more very high. These labels prioritize investigation. They do not mean the system will lose the same percentage of FPS, and they should never be added to or subtracted from a benchmark.
The calculator also cannot model every engine, instruction set, cache-sensitive simulation, ray-tracing implementation, encoder or AI framework. VRAM and RAM capacity may dominate even when compute indices appear balanced. Laptop power limits and vendor-specific cooling create further variation. For these cases, use the result only to choose the first measurement.
How to validate a bottleneck calculator result
- Define one software version, repeatable scene, resolution, settings preset and performance target.
- Log frame time or completion time, per-core CPU activity, GPU utilization, effective clocks, temperatures, power and memory pressure.
- Capture a baseline after a consistent warm-up.
- Lower resolution or one graphics-heavy setting and repeat. A clear performance rise shows GPU sensitivity.
- If performance remains flat, inspect saturated CPU threads, engine limits, memory latency, frame caps and background work.
- Correlate spikes with VRAM, RAM, storage, temperature or power events before assigning the cause.
Use the interactive PC bottleneck checklist to preserve this sequence, the frame-time calculator for refresh targets, and the resolution pixel-load calculator for native-resolution comparisons.
Component data and revision policy
The current catalogue combines curated current-generation tiers with a broad production component snapshot. Catalogue scores are normalized for relative comparison; they are not vendor claims or a replacement for application benchmarks. Names and current normalized values are available through the public component endpoint.
Evidence classes are kept separate
| Data class | Used for | Not used to claim |
|---|---|---|
| Curated current component tier | Relative CPU or GPU placement in the directional model | Exact game FPS, price or universal rank |
| Legacy production catalogue record | Exact model lookup inside the calculator | A reviewed profile or editorial recommendation |
| User scenario input | Resolution, frame target, workload and optional context | Telemetry from the visitor's computer |
| User measurement | Final validation in a repeatable workload | Automatic recalibration of the public model |
The site does not currently have a game-by-game benchmark distribution, product power database or live price feed. It therefore does not publish predicted game FPS, confidence intervals, power-supply wattage or “frames per dollar.” Adding those fields without versioned sources would create a more impressive result but a less trustworthy one.
The dataset carries a July 30, 2026 review date. A tier changes when broader evidence changes relative placement, not because of one isolated benchmark. New products should be added only when their identity and performance tier can be supported. The technical source library explains which primary standards, platform documentation and measurement tools match different claims. Corrections can be submitted through the contact page with the exact component name and reproducible evidence.
Indexing policy for component pages
All 5,494 components remain searchable in the calculator. A much smaller reviewed set receives a detailed CPU profile, GPU profile or pairing page. A guide is published only when it contains component-specific decision context, validation steps, model provenance and natural links to related evidence. Unsupported model addresses return a clear not-found response rather than repeating generic advice.
Calibration, uncertainty and revision history
The model is calibrated as a directional ranking system. Scenario factors are reviewed against expected workload behavior: lower rendering resolutions and higher frame targets should increase relative CPU pressure, while higher pixel load and accelerator-heavy workloads should increase relative GPU pressure. A change is accepted only when it improves the direction of the model across multiple representative scenarios without implying application-specific FPS.
Uncertainty is highest when a workload depends on capacity, software support, engine behavior, thermal limits or laptop power envelopes that a component name cannot capture. The calculator exposes a severity band instead of a confidence interval because the site does not collect the application-level benchmark distribution needed to estimate one honestly.
| Revision | Date | Material change |
|---|---|---|
| 1.0 | July 30, 2026 | Published normalized tier comparison, resolution, frame-target and workload factors, severity bands and public component endpoint. |
Performance Methodology Review
Performance Methodology Review is the named review entity for calculator assumptions and diagnostic claims on this site. Its job is to check that a page distinguishes estimates from measurements, identifies the scenario being discussed, avoids guaranteed performance claims and recommends a reproducible verification step. The review is an internal editorial function of BottleneckCalculator.biz, not an independent laboratory certification.
What a review checks
- The target query and scenario are explicit.
- CPU, GPU, memory, storage, temperature and power are not treated as interchangeable causes.
- Advice separates free configuration fixes from paid upgrades.
- Dates, component references and calculation factors match the published implementation.
- Structured data describes visible content and does not invent ratings, authors or tests.
Method changes will be reflected on this page and in the implementation. Readers should save real measurements with their result link because a model revision can change the directional estimate while the observed system behavior remains the most important evidence.
