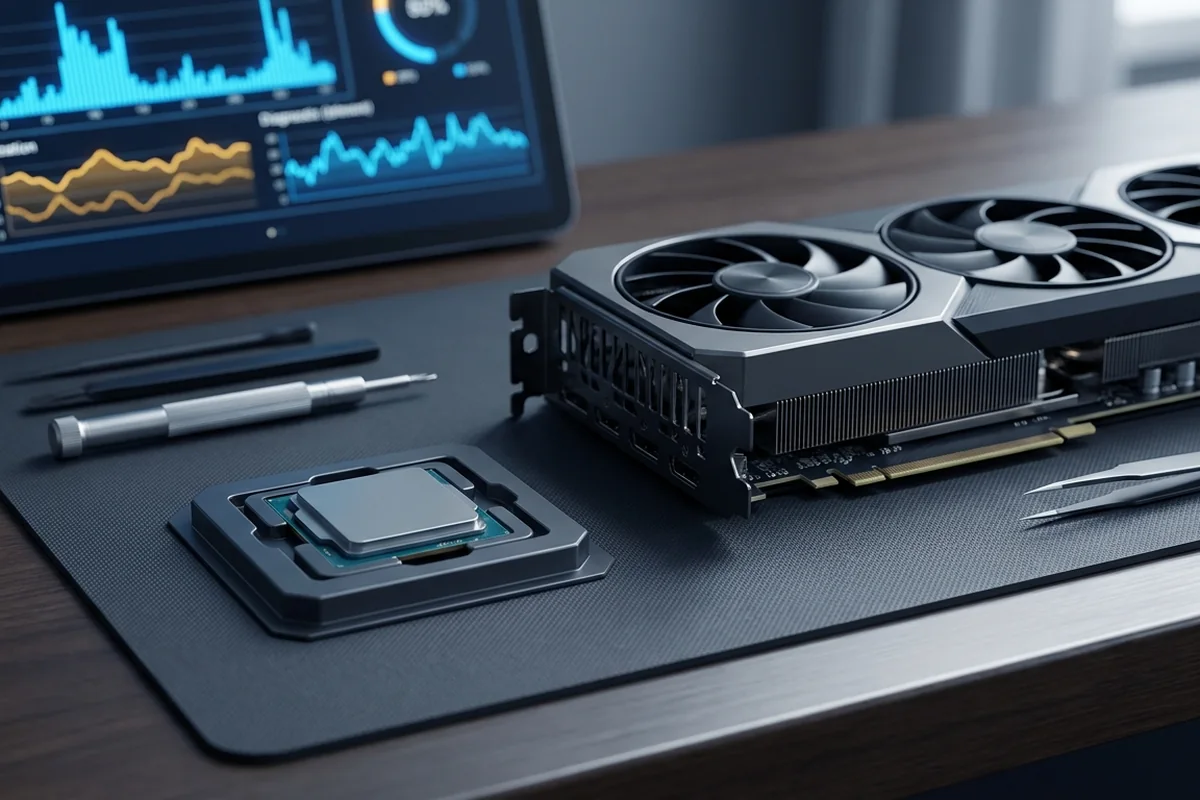
01 · Utilization
Watch the relationship, not one percentage.
A CPU can limit a game with modest total usage when one critical thread is saturated. A GPU can sit at 99% and be operating exactly as intended.
Read utilization correctly →Match your CPU and GPU to the resolution, frame target and workload you actually use. Get a transparent estimate and a practical test plan in seconds.
| Scenario | Direction | Tier gap |
|---|
This is a directional estimate, not a guaranteed FPS prediction. Confirm with frame-time and utilization measurements in your actual software.
Context, not guessworkResolution, frame target and workload are part of every result.
Transparent by designSee the model’s limits and learn how to verify the estimate.
Made to be sharedSave a result URL or publish the free responsive widget.
The result compares normalized CPU and GPU tier indices after applying the selected resolution, frame target and workload factors. The percentage is the rounded distance between the two adjusted headroom values. It identifies the lower side as the first path to investigate; it does not claim that the same percentage of FPS is lost.
| Input | Why it changes the balance |
|---|---|
| Resolution | Changes the graphics work performed for each rendered frame. |
| Frame target | Changes the time available for CPU frame preparation. |
| Workload | Adds different compute, encoding and memory pressure. |
Every result links to a validation checklist. The complete formula, current coefficients, worked example, limitations and revision history are published in the bottleneck calculator methodology. For focused frame-time and resolution calculations, browse the PC performance calculator collection.
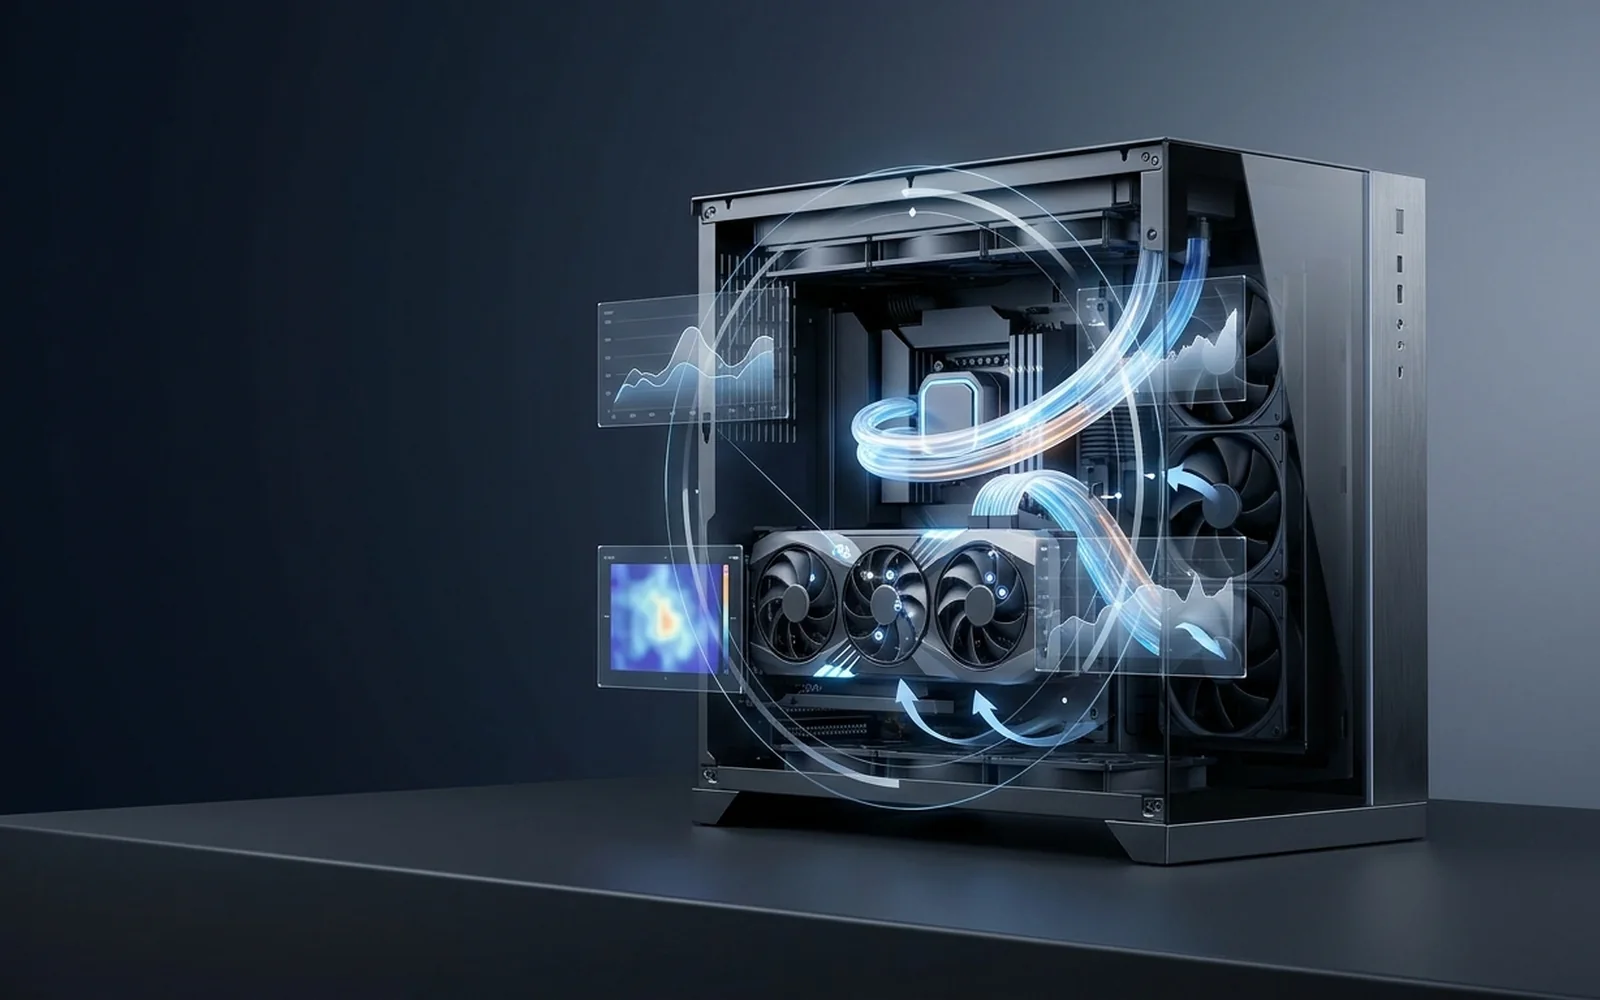
A real diagnosis connects a predicted limit to the way your system behaves. These are the three signals worth checking before you spend.
A CPU can limit a game with modest total usage when one critical thread is saturated. A GPU can sit at 99% and be operating exactly as intended.
Read utilization correctly →1% lows and the frame-time graph expose stalls that an average FPS figure hides.
Understand frame time →Lower resolution, repeat the same scene and compare. The response tells you which stage deserves attention.
Run the 20-minute test →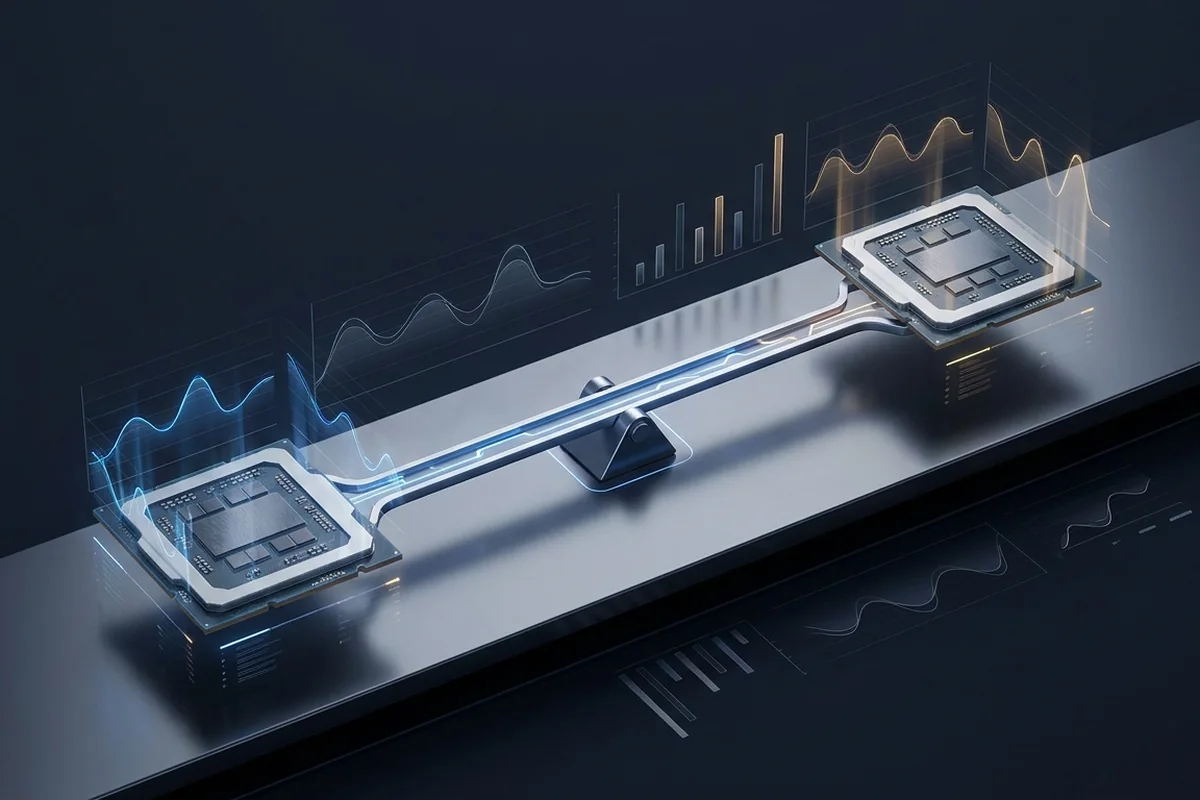
At 1080p and 240 FPS, the CPU has only a few milliseconds to prepare each frame. At native 4K, the GPU processes four times as many pixels as 1080p. The same PC can be CPU-limited in one scenario and GPU-limited in the next.
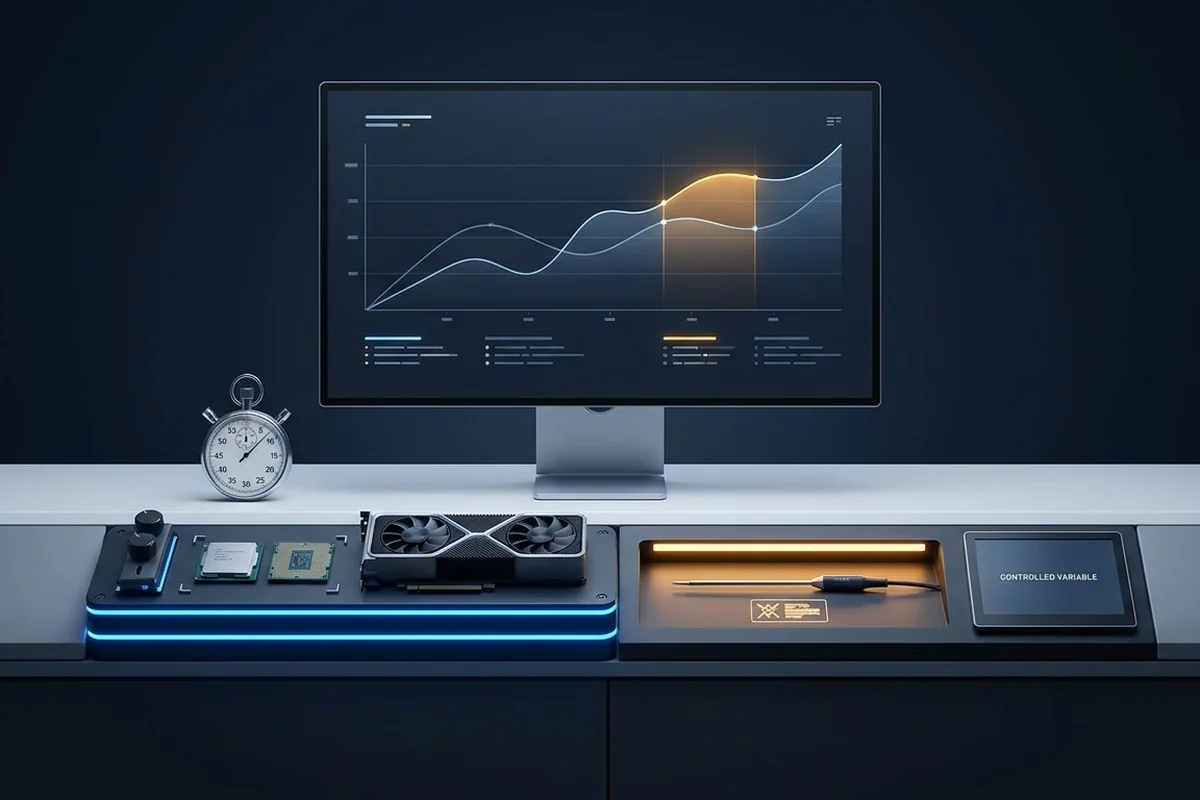
A repeatable test plan using utilization, frame time, temperatures and controlled setting changes.
Read How to Check a PC Bottleneck in 20 Minutes →
Why no single percentage can describe every game, and how to use an estimate without being misled.
Read What Does a Bottleneck Percentage Mean? →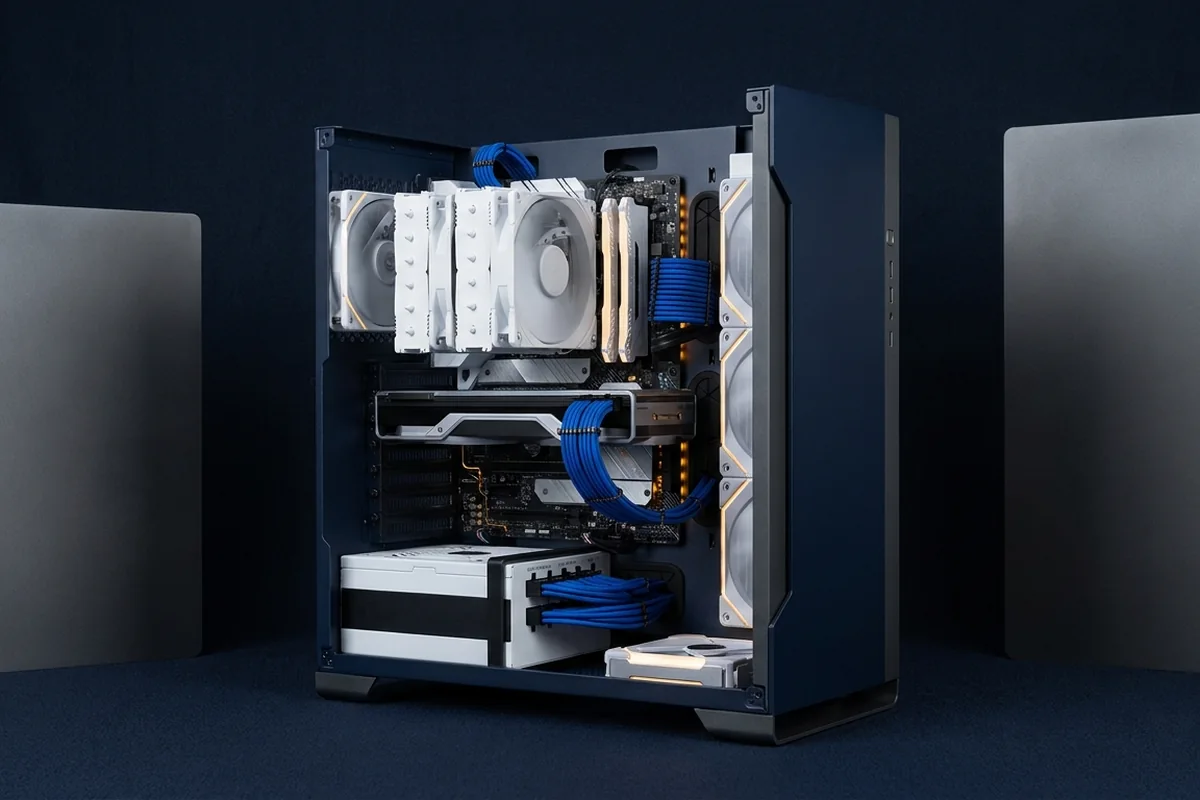
A budget framework that aligns the display, CPU, GPU, memory, cooling and power supply around one clear target.
Read How to Plan a Balanced Gaming PC Build →Compare how popular combinations shift at 1080p, 1440p and 4K across different frame targets. Open a pairing to see the directional result, the first validation test and detailed guides for both components.
5% relative tier gap in this directional scenario. Validate it with frame-time and utilization data.
Compare three resolutions →20% relative tier gap in this directional scenario. Validate it with frame-time and utilization data.
Compare three resolutions →11% relative tier gap in this directional scenario. Validate it with frame-time and utilization data.
Compare three resolutions →39% relative tier gap in this directional scenario. Validate it with frame-time and utilization data.
Compare three resolutions →9% relative tier gap in this directional scenario. Validate it with frame-time and utilization data.
Compare three resolutions →16% relative tier gap in this directional scenario. Validate it with frame-time and utilization data.
Compare three resolutions →Good tools state their limits. Our score is a directional estimate designed to help you decide what to measure next.
View all questions →No. Every workload has a slowest stage. It matters when that stage prevents the performance or smoothness you need.
It is a scenario-aware estimate based on normalized component tiers. Real games, settings, cooling and background work still need measurement.
Do not treat a single threshold as a verdict. A small mismatch is normal; investigate when the predicted limit aligns with an unmet target.
The result points to the limiting path and practical checks first. Product choice should follow budget, compatibility and measured need.
